You might have heard it mentioned in passing? You may even have had your manager ask you about?
So what is Microsoft Clarity and what exactly does it do?
Microsoft Clarity is a web analytics tool designed by Microsoft to gain valuable insights into your website visitors’ behaviour. It tracks measures the way that it interacts with your website giving you metrics like:
- Click-through rates
- Scroll depth
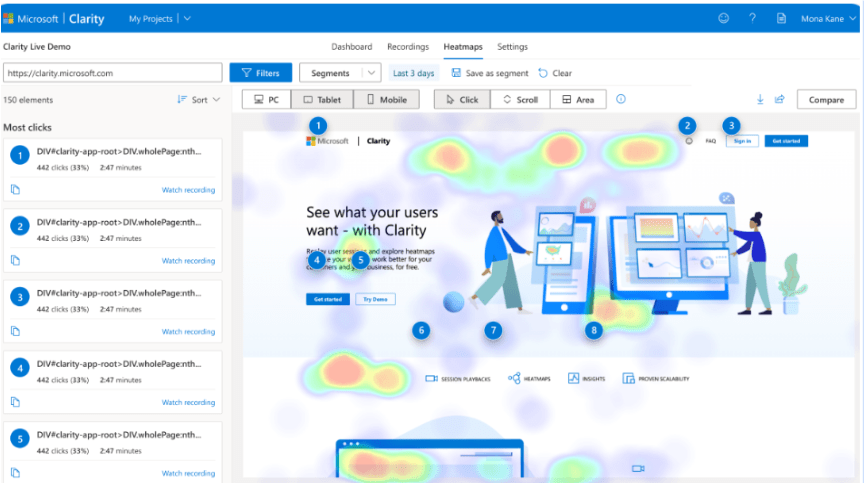
- Heatmaps, revealing where users engage most
The data presentation is visual and it helps spot trends and areas for improvement. These insights can be invaluable for business owners and marketing teams, but how can you use them to improve performance?

Source: https://clarity.microsoft.com/
6 Ways To Drive Performance With Microsoft Clarity
1. Improved Conversion Optimisation
If you have a landing page and don’t know where to start optimising the page Clarity can provide, well, clarity. Why?
You get useful insights into using things like heatmaps to get insight into which elements of the page your users are interact with.
By understanding how visitors interact with the website, you can understand:
- Which CTAs are getting the most traction
- Whether there are elements that are distracting people from the main goals
- Which content on the page users value the most
And then you can make design decisions to remove the stuff that isn’t working or negatively affecting conversion rates.
2. Identifying Performance Bottlenecks
You have a site, and it performs brilliantly – or does it?
Sometimes it is worth a sanity check and take stock of how your website is performing. You can do this by evaluating Clarity’s session recordings. Why?
You can pinpoint where users drop off during their journey. You can then take corrective action and improve the user experience of the website. Having a tool that provides strong visualisation can help enrich conversations amongst stakeholders and help establish areas of improvement.
3. Optimising Ad Spend
Traffic from different channels has different behaviour. Understanding those differences is the key to optimising your ad spend. And it’s especially critical if you have some channels which are spending a significant amount of money.
By using the Clarity you can do things like:
- View quickbacks; the moment move to a new page but immediately return to the old one
- Slice and dice data; you can filter by things like campaign, browser, location and page to drill down to see things like whether the performance is weaker for a certain campaign in a certain location or whether by browser or device type it performs significantly worse.
All of this data allow you to ask questions around things like messaging or even whether the campaign needs a dedicated landing page.
You can then start to resolve those issues to make the most out of your biggest ad channels.
4. A/B Testing Validation
Einstein famously said “it takes a genius to make something simple” and sometimes pages are needlessly complex.
With Clarity you can A/B tests on landing pages or website elements and the data can provide objective evidence on the effectiveness of each variation. This can help you make informed decisions rather than going on gut feel.
5. Competitive Analysis
Once you have a heatmap and user behaviour, you can then cross reference this with what your competitors are doing on site.
You can take the heatmap and identify the problem areas of each of your key landing page templates. Then one-by-one conduct a competitor analysis to identify what they are doing for those elements and how it differs from yours.
From this you can quickly start to identify some potential design and UX changes that you can make. Those changes can range from small, easy to implement quick wins to bigger more resource intensive one. Once you’ve got your list of changes, you can develop a testing roadmap and start identifying whether those changes actually drive performance and with the ones that do – implement them.
6. Real-time Monitoring
The Clarity tracking code captures clicks, scrolls, form submissions and more, once it hits Microsoft’s server it is ready for analysis in the Microsoft Clarity Dashboard immediately. Why is this useful?
You can spot and analyse unexpected changes in user behaviour in real-time, so you can make timely adjustments to the website. Fixing issues that impact user behaviour, can keep customers happy and ensure the conversion funnel is optimised.
These seven insights can help drive performance, and the visualisations in Microsoft Clarity are really eye-capturing, so look no further and set it up!
Summary
Microsoft Clarity is a powerful tool that can be used to improve conversion rate of your site and by proxy the performance of your ad campaigns.
You can use it to:
- Improve conversion optimisation
- Identify bottlenecks
- Optimise ad spend
- A/B test
- Competitor analysis
- Monitor UX issues in real time
If you’re looking for more information on Microsoft Clarity, don’t be afraid to reach out via email or on one of our social channels.

